Reading your numbers
Home, analytics reports, drop-off and live view.
1 min read · updated 1 October 2026
Get started
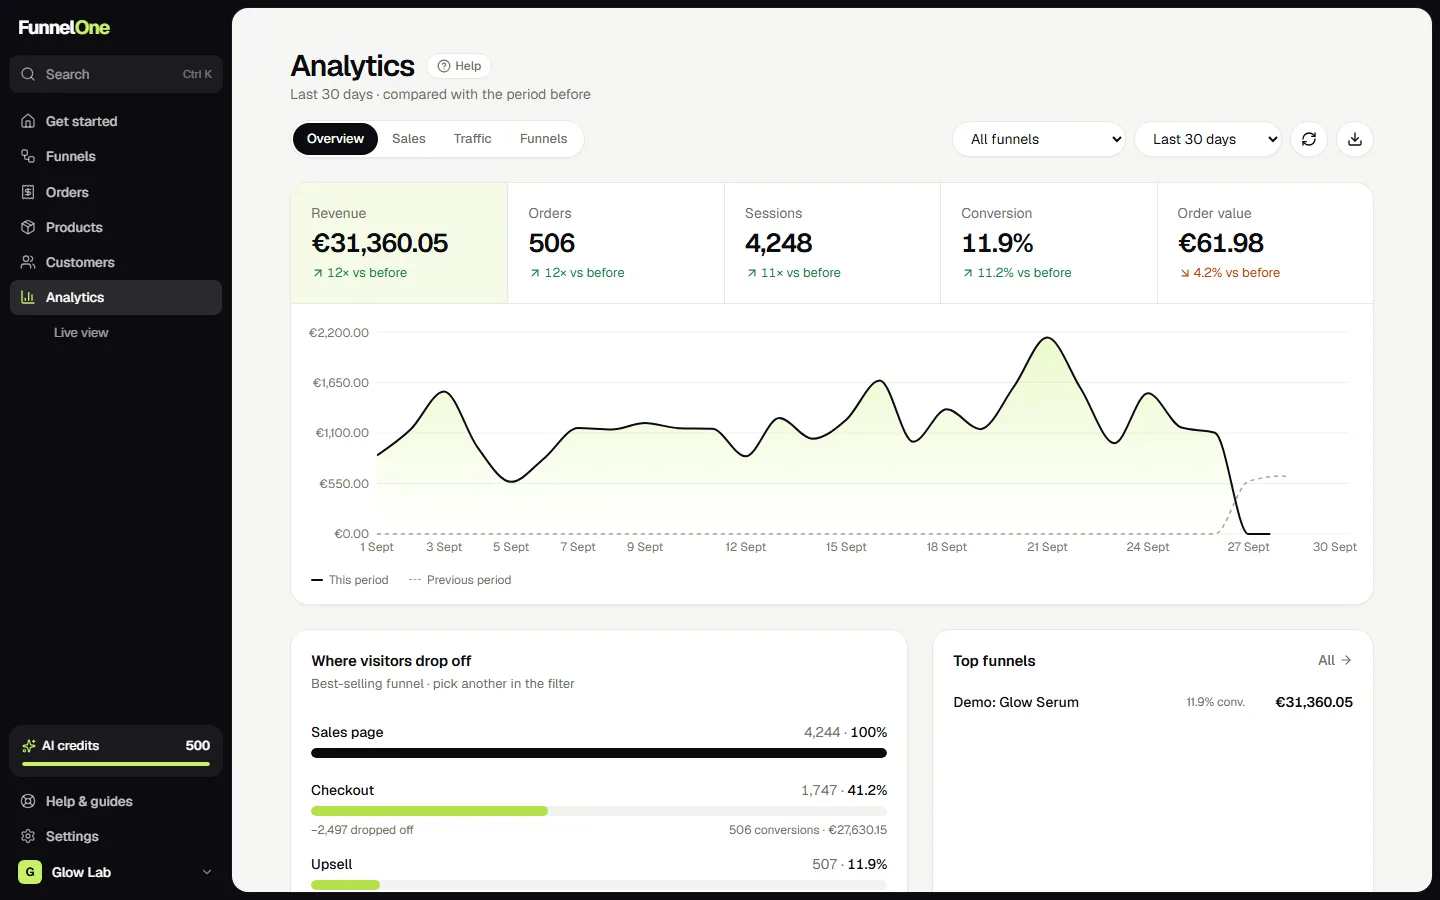
The black tile shows your revenue for the chosen period with a chart, plus orders, visitors, conversion rate and average order, each compared with the period before. The lime Right now tile counts people on your funnels at this moment.
Below, Where visitors drop off shows your best-selling funnel step by step and points out the biggest drop, with a tip on what usually helps.
Analytics
Analytics has four reports: Overview, Sales, Traffic and Funnels. Filter by funnel and period, and download the data.
Live view
Analytics → Live view refreshes every few seconds: visitors on your funnels right now, which pages they're on, revenue and orders today, and a feed of everything that happened in the last 24 hours.
What the numbers mean
- Conversion rate: the share of visitors who bought.
- Average order: revenue divided by orders, including upsells and bumps.
- Continue % on a funnel: how many visitors of a step reached the next one.
Was this guide helpful?
Try it in your own store
Free for 14 days. Every feature, no credit card.