Feature · Analytics
Know what works, at a glance
See which ads bring buyers, where people drop off and how much your upsells add. Every number is compared with the period before.
- 14 days free
- No credit card
- Cancel any time
4
reports: overview, sales, traffic and funnels
Drop-off per step
See exactly where visitors leave your funnel.
Sources & campaigns
Revenue per source, medium and campaign from your UTM tags.
Export anything
Download the numbers as CSV whenever you need them.
Money first
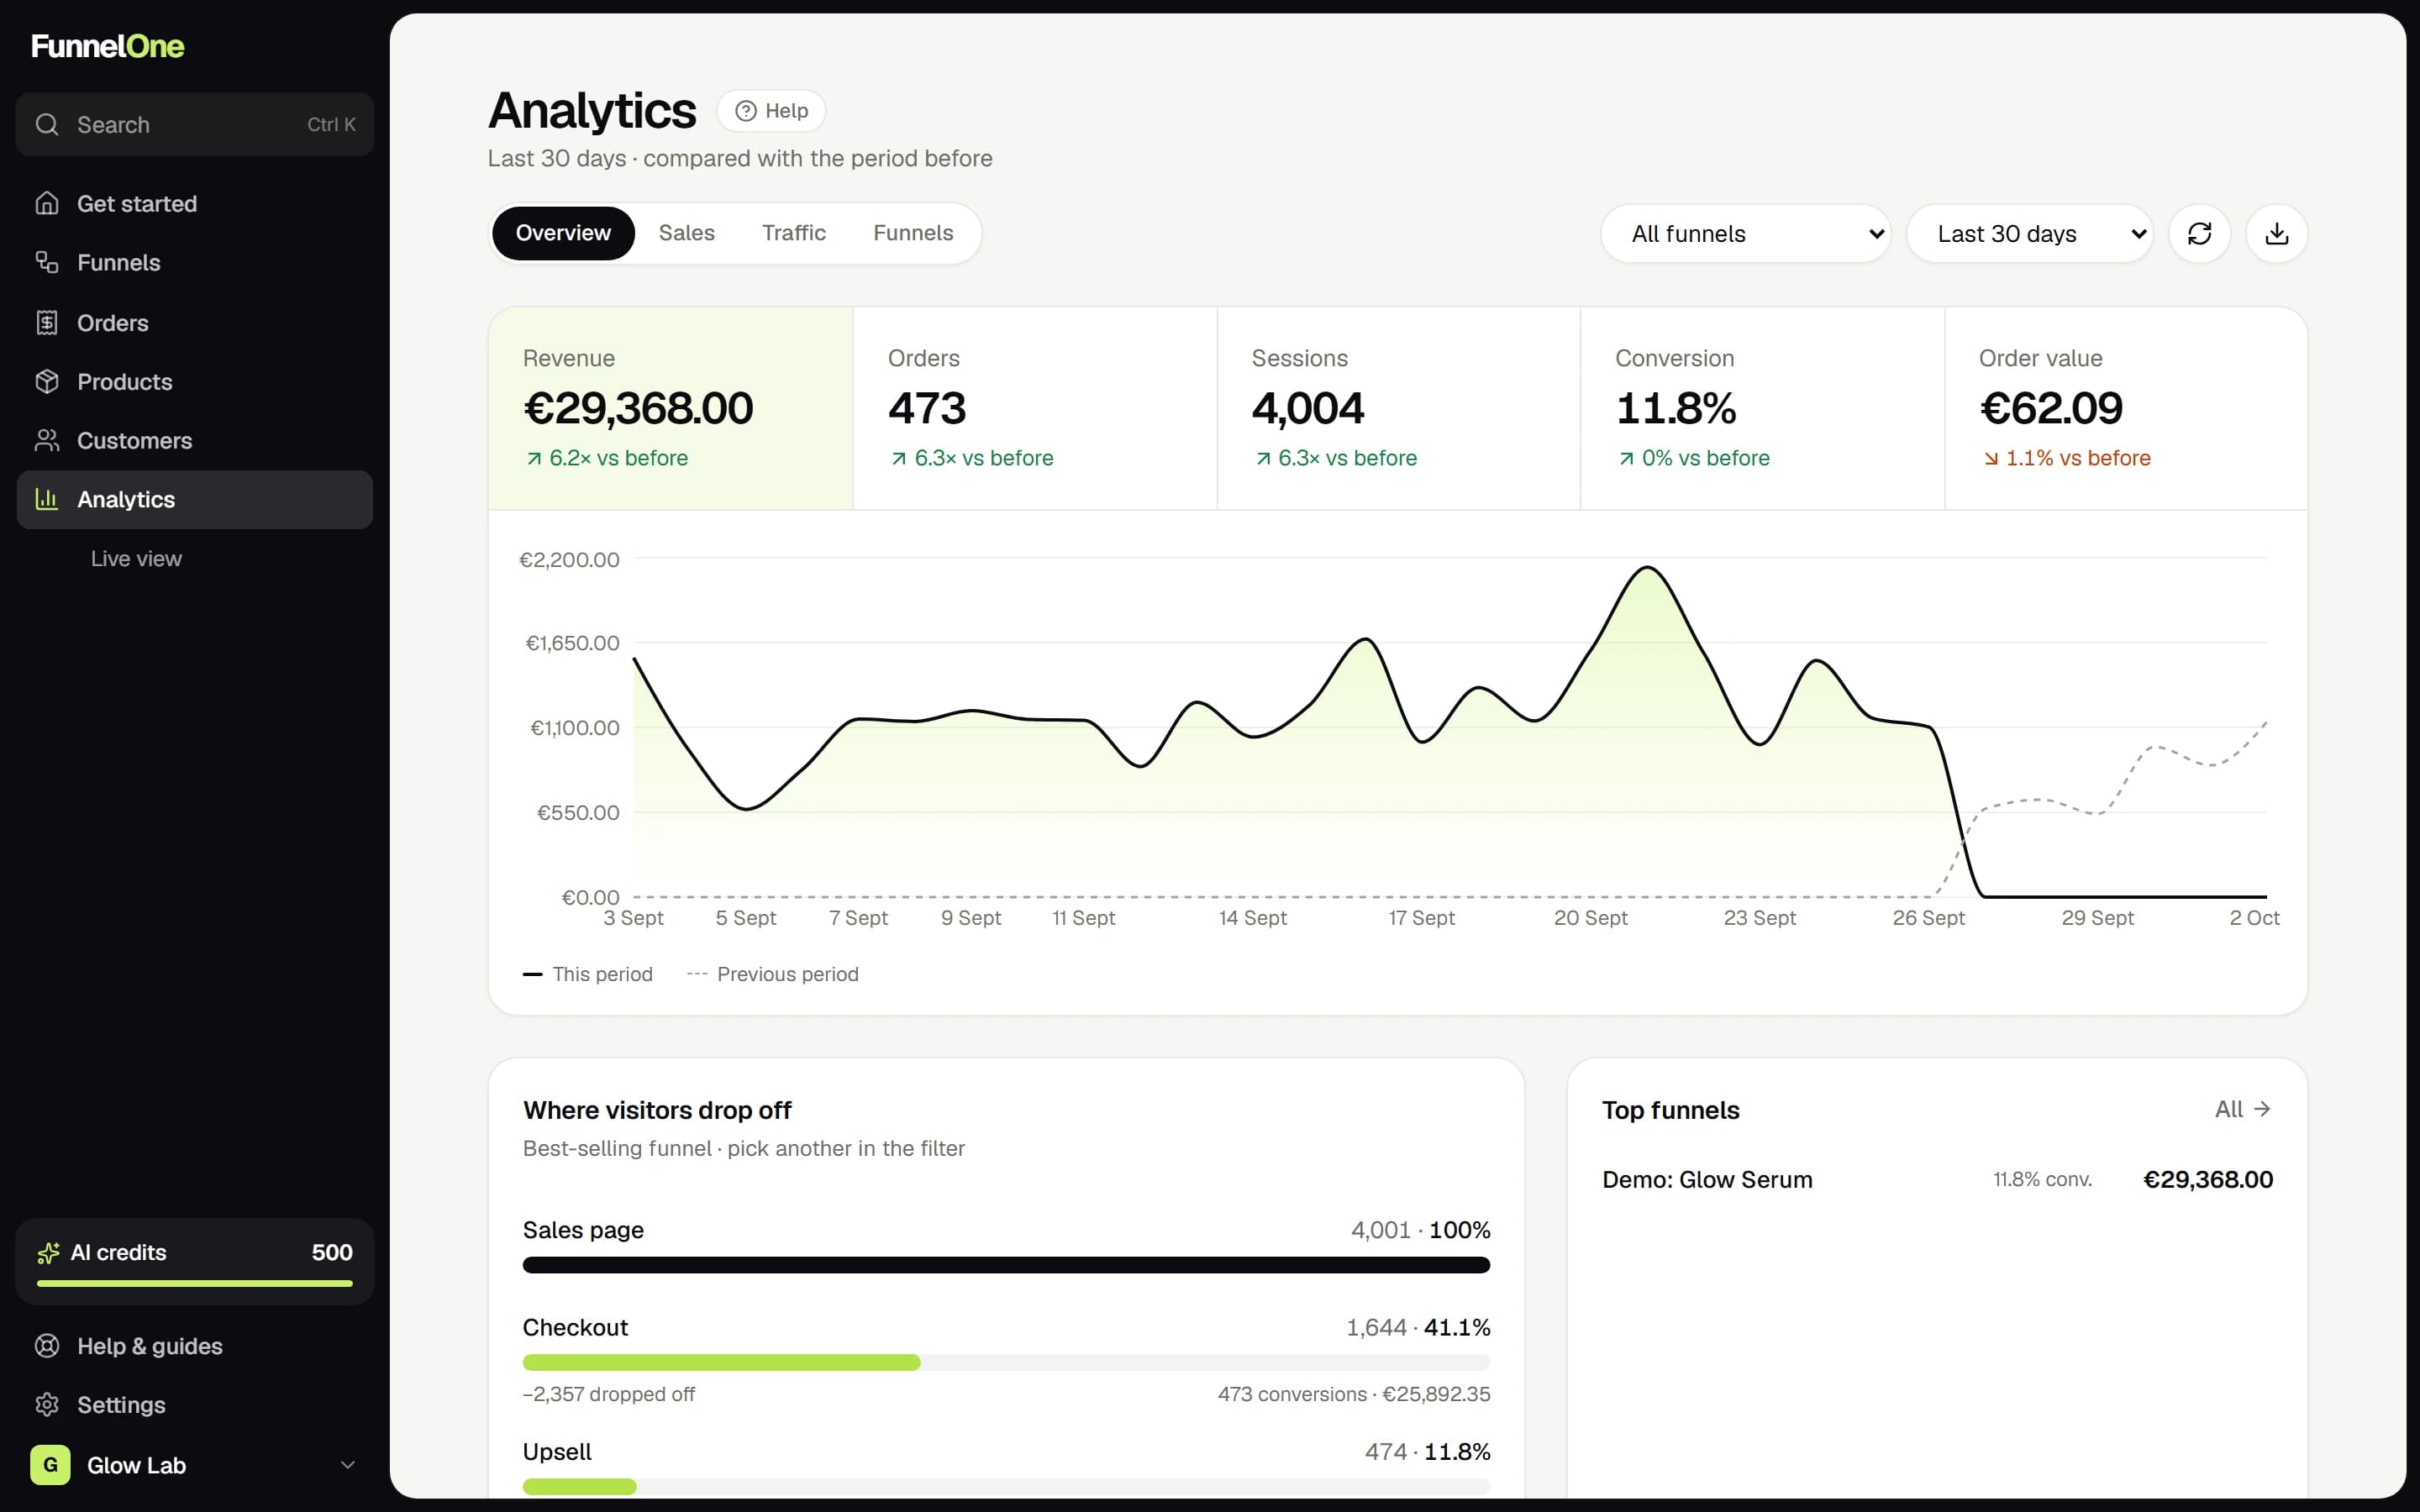
Revenue, orders, conversion and average order value on one screen, with the change against the previous period. Plus how much of your revenue came from bumps and upsells.
- Compared with the previous period
- Extra revenue from offers
- Filter by funnel and date range
Find the leak
The drop-off chart shows how many visitors reach each step. Fix the step where you lose the most people first; that's where the biggest win is.
- Visitors per step
- Opt-in rate per step
- Devices and countries
What changes for you
Ad platforms each claim the sale
Revenue per source and campaign
No idea which step loses buyers
Drop-off per step on one chart
Spreadsheets to see revenue
Everything on one screen
Who it's for
Media buyers
Which campaign brings buyers, not just clicks.
Founders
Revenue and order value in ten seconds a day.
Conversion work
Pick the step to optimise next.
How it works
- 1
Share your link
Tracking starts automatically.
- 2
Add UTM tags
Get revenue per ad and campaign.
- 3
Improve
Fix the step with the biggest drop-off first.
What's included
- Overview, sales, traffic & funnel reports
- Period comparison
- UTM reports
- Drop-off per step
- Heatmaps & scroll depth
- Anonymous benchmarks
- CSV export
- Meta & TikTok pixels
Questions
Do I need Google Analytics?
No. You can still add Meta and TikTok pixels for your ads.